
Web AppAI-Enhanced
AI Canvas
An open-source library of AI-native UI components. Install via shadcn CLI or remix with AI.
{ CASE STUDY }
Real-time earnings intelligence for everyday investors - designed and shipped entirely with AI at the Figma Makeathon 2026.

Most financial tools are built for analysts. Signal is built for everyone else.
{ RESEARCH }
I didn't start with the stock market. Using Claude as a research partner, I brainstormed across industries - healthcare, education, logistics, finance - filtering for spaces where AI could solve a real information problem, not just add a chatbot to an existing product. I narrowed by three criteria: data richness, user pain, and feasibility within the Makeathon timeline.
Starting question
Where can AI solve a real information problem - not just add a chatbot?
6 industries explored
Healthcare
38.6% CAGR
Education
Fragmented market
Logistics
Slow adoption
Real Estate
Slow digital adoption
Finance
19.6% of AI market
Retail
3.7× avg ROI
Finance - sub-areas evaluated
{ COMPETITIVE LANDSCAPE }
Yahoo Finance, Nasdaq, Investing.com - earnings calendars buried inside massive portals. A data table: ticker, date, EPS estimate, actual. No context, no narrative.
Earnings Hub, Stock Events - better focus, but still assume financial literacy. Built for people who already understand EPS, revenue surprises, and analyst consensus.
AlphaSense, Fiscal.ai, Aiera — powerful AI on earnings transcripts. But enterprise-priced ($29–$79/month+), designed for professional analysts. Inaccessible by design.
{ THE GAP }
No product takes live earnings data and translates it into plain language for everyday investors. No product answers: “What should I know about this company before they report tomorrow?” - in a way that anyone can understand.
{ PROCESS }
Traditional design thinking follows a linear path: Empathize → Define → Ideate → Prototype → Test. It's a proven framework, but it assumes time that a hackathon doesn't give you. More importantly, it separates research from building - you finish thinking before you start making. My process for Signal collapsed that sequence. Research, design, and building happened in parallel, with AI accelerating every stage.
Phase 1
I used Claude to brainstorm industries, identify opportunities, and map the competitive landscape. This wasn’t passive research — it was an active conversation where I challenged assumptions, narrowed scope, and validated ideas in real time. Once the earnings calendar concept emerged, I verified Claude’s findings against real data: checking Finnhub’s API documentation, reviewing competitor apps, and confirming the information gap existed.
I also used my AI design twin — a version of Claude I’ve been training with my design philosophy and decision-making process — to stay true to my instincts throughout. The twin helped me evaluate layout decisions, critique my own work, and maintain design consistency at the speed the Makeathon demanded.
Phase 2
With the concept validated, I moved directly into Figma Make. No separate wireframes, no static mockups handed off to a developer. Figma Make allowed me to design and build simultaneously — crafting the interface while wiring up real functionality. This is where the traditional process would have me in a wireframe phase; instead, I was already shipping.
Phase 3
I tested Signal with traders to evaluate whether the interface was intuitive, whether the AI-generated insights were useful, and whether the information hierarchy matched how they actually think during earnings season. Their feedback directly shaped refinements.
{ ARCHITECTURE }
Two APIs working in tandem - one for raw data, one for meaning.
For every reporting company, Claude generates a plain-language summary: what the company does, what analysts expect, what to watch for, and how results compare to forecasts. This is Signal's core differentiator - turning raw financial data into something anyone can read without a finance degree.
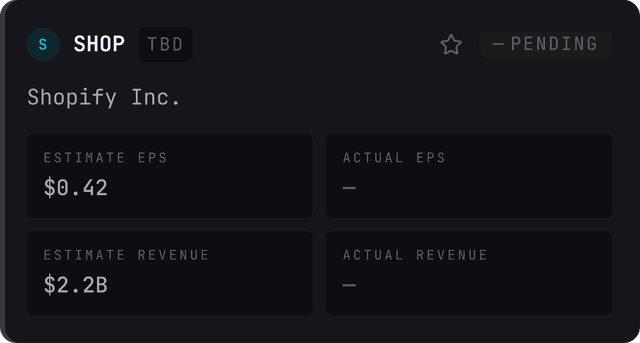
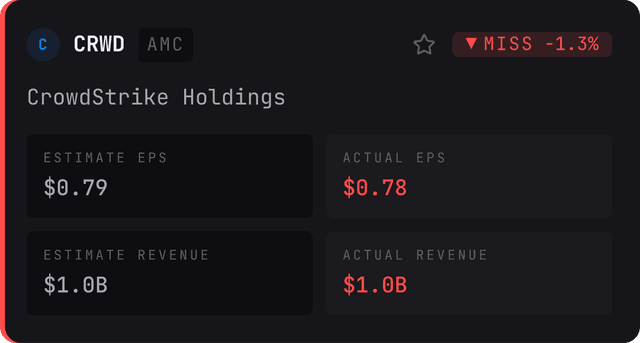
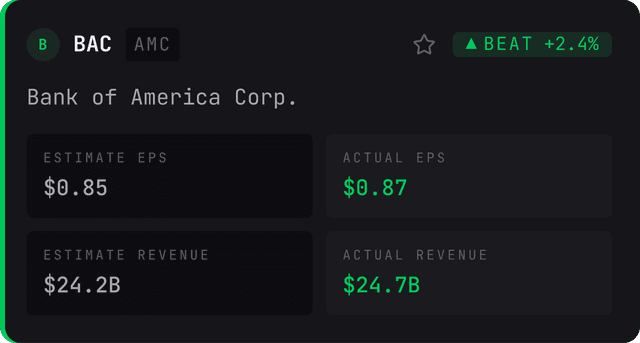
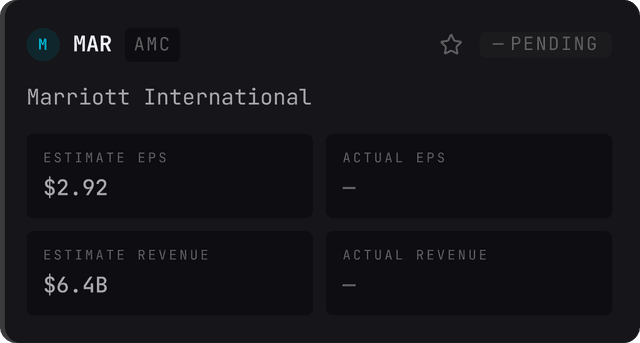
Company names, reporting dates, EPS estimates, actual results, stock quotes, and company profiles - pulled via a single date-range query instead of hundreds of individual API calls. Scoped to Q1 earnings for US companies: a constraint that made the product faster and more focused.

{ CHALLENGE }
Integrating APIs inside Figma Make meant testing multiple data providers to find one that was reliable, had the right data structure, and worked within the platform's constraints. I tested several financial data APIs before landing on Finnhub.
Narrowing from all earnings, all year, to Q1 US companies wasn't a compromise - it was a design decision. The constraint made Signal more focused, faster, and more useful.

{ THE RESULT }
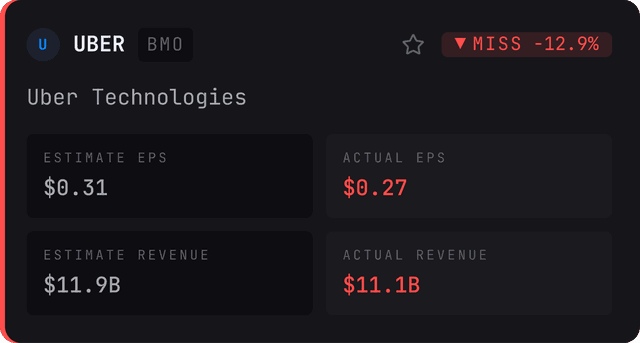
Signal is a real-time earnings calendar that tells you who's reporting, what's expected, and whether they beat - with AI-generated context on every company card.
The app received positive feedback from the community. It didn't win the Makeathon, but the response confirmed something more valuable: the concept has real potential. The gap between dense financial data and accessible, AI-powered earnings intelligence is genuine and underserved.
I'm considering taking Signal forward - beyond the Makeathon prototype - to build it into a more complete product.
{ LEARNINGS }
AI as a design collaborator changes the process, not just the speed. Research, design critique, and product functionality - AI was embedded in every layer, not bolted on as a tool.
Constraints improve products. Narrowing from full-year global earnings to Q1 US companies made Signal more focused, faster, and more useful. The limitation pushed a better design decision.
Plain language is a design choice. The AI insights on each card aren't a technical feature - they're a statement about who this product is for. Choosing to explain earnings in human language is a decision about accessibility and audience.
Figma Make enables a new workflow. Designing and shipping in the same tool eliminates the handoff gap. For a hackathon, this is transformative. For the industry, it signals where design tooling is heading.
{ MORE CASE STUDIES }

